Price nearly always plays a part in the decision-making process of purchasing wine. Typically, much emphasis is placed on the importance of “value” – “how much quality am I getting for the price of this bottle”, for which Wine Lister has its very own indicator, Value Picks. However is simply offering “good value” enough?
Wines purchased for long-term cellaring carry financial risk just as investment does. With this in mind, Wine Lister’s Economics scores reflect not only a wine’s price, but the performance of that figure over time. As well as a three-month average market price, and six-month / three-year price growth, Wine Lister’s algorithm takes into account price stability as a factor in determining a wine’s Economic strength.
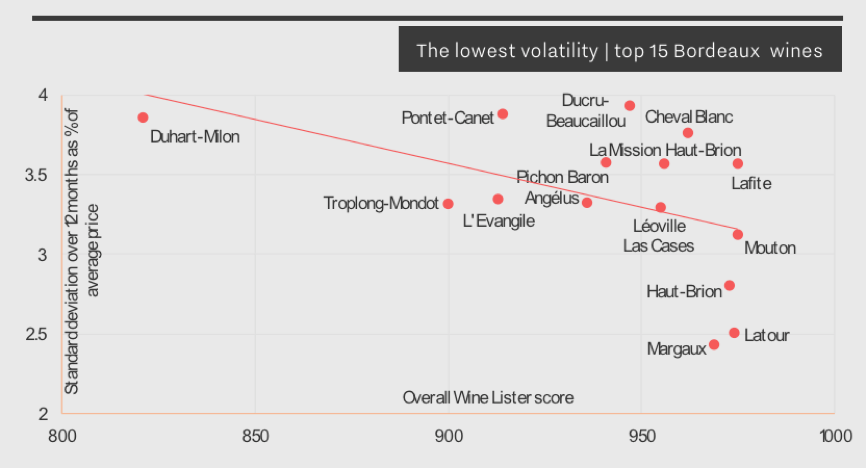
Using historical prices provided by our data partner, Wine Owners, we calculate the standard deviation of a price over the last 12 months, expressed as a proportion of the average price over the same period.
Volatility can be caused by price movements both up and down. Nobody wants to see the price of a wine plummet after purchase, but equally, wines with prices rising too high and too fast display risk too, and are therefore also sanctioned with lower Economics scores.
Below is an extract from this year’s Bordeaux Market Study featuring the 15 most stable Bordeaux wines. All five left bank first growths appear, testament that higher-scoring wines tend to experience less volatility. This is also tied in with liquidity: frequently traded wines tend to benefit from multiple reference points allowing a consistent market price to be determined. Conversely, a wine traded less frequently often sells at a markedly different price from one transaction to the next, resulting in a much more volatile market price.
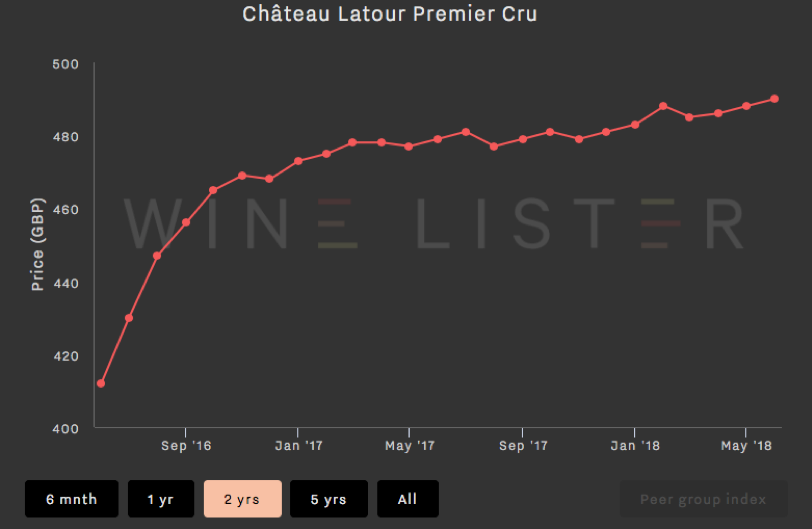
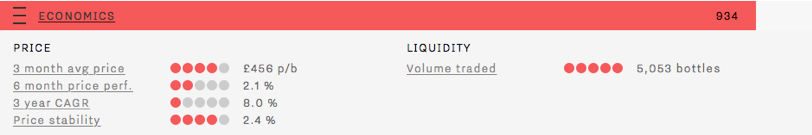
While Château Latour’s slow and steady price growth (as shown in the chart below) results in relatively low six-month price performance and three-year compound annual growth rate (CAGR) ratings, its strong Economics score is thanks to a high three-month average price, a high volume of bottles traded at auction, and a low price deviation of just 2.4% over the last 12 months.
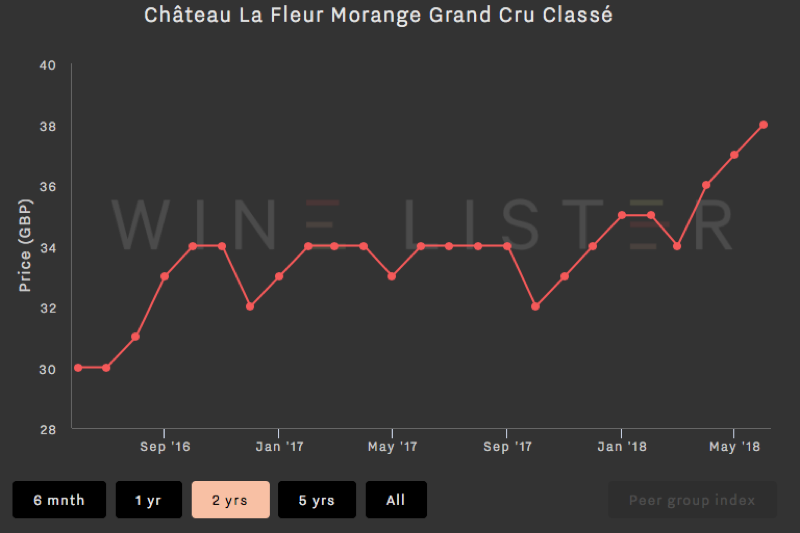
The chart below shows a very different picture – this wine has experienced a 14.7% price increase in six months. Though this in itself is positive, its price has therefore deviated 12.5% in the last 12 months, and the yo-yoing nature of the price over the longer term earns it a much lower Economics score (492).
En primeur pricing is a crucial factor in the commercial success of top Bordeaux crus. With this in mind, Wine Lister has dedicated a section of this year’s Bordeaux study to the conundrum. We show historical pricing trends post release for a panel of 76 wines. The analysis indicates the effectiveness of release prices, based on the change between average ex-négociant release and current market prices (2009-2016 vintages):
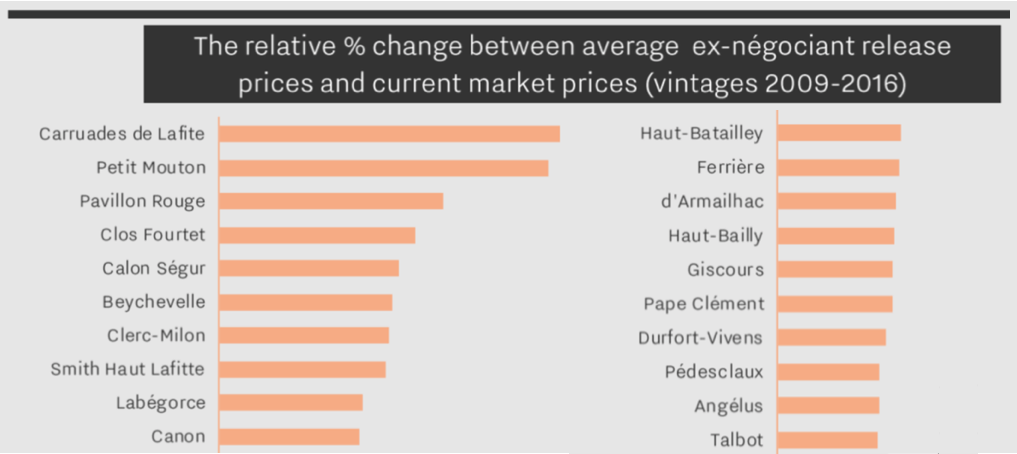
Above are the top 20 best-performing Bordeaux wines post en primeur release (to view the performance of all 76 wines, see page 14 of the Bordeaux study). The second wines of Lafite and Mouton have enjoyed the greatest gains in the marketplace, with Pavillon Rouge not far behind in third place.
Clos Fourtet is the best of the rest, followed by Calon Ségur, Beychevelle, Clerc-Milon and Smith Haut Lafitte. Lafite is the best-performing first growth, followed by Margaux and Mouton, with Haut-Brion making smaller gains.
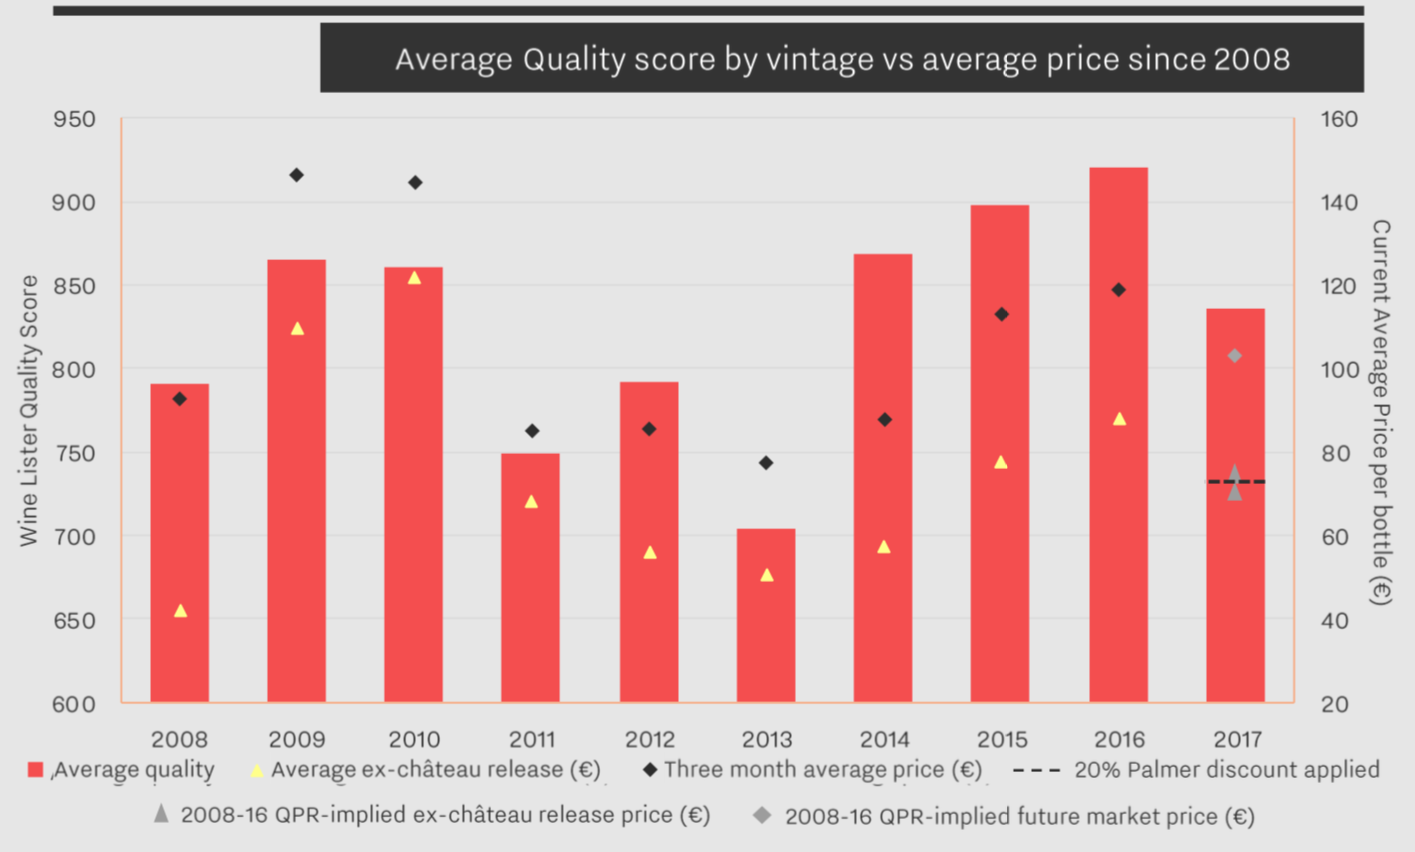
This year’s en primeur campaign has not yet been met by the same enthusiasm as the 2016 or 2015 vintages. The average quality of 2017 is lower (by 10% if we take Wine Lister Quality scores for the same 76 wines) – a major factor in explaining price sensitivity, and why the average discount so far of 7% (9% excluding Haut-Batailley’s contrary price hike) is far from sufficient to oil the wheels of the campaign.
In our Bordeaux Market Study 2018, released just last week, we clarify an illustrative methodology for calculating release prices. Wine Lister looks at current market prices for similar recent vintages, and works backwards through three steps:
- Vintage comparison: As there is no obvious comparison for 2017, we apply the average quality to price ratio of the last nine vintages in order to arrive at a derived future market price, based on the average Wine Lister Quality score.
- Ex-château price: By removing the margins taken by the négociant and importer we reach the equivalent ex-château price.
- En primeur discount: Finally, we apply a discount of 10%-20% to incentivise buying en primeur, rather than waiting until the wine is physically available.
The chart below shows the theoretical application of this methodology to a basket of top wines. See page 13 of the Bordeaux study for a more detailed explanation.
Prices released in the campaign thus far have varied from 20% discounts (Palmer, Domaine de Chevalier Rouge) to a 46% increase (Haut-Batailley) on last release prices.
Follow Wine Lister on Twitter for realtime en primeur release information, and use our dedicated en primeur page to compare 2017 release prices to last year.
Other wines featured in the top 20 best-performing Bordeaux post en primeur release are: Labégorce, Canon, Haut-Batailley, Ferrière, d’Armailhac, Haut-Bailly, Giscours, Pape Clément, Durfort-Vivens, Pedesclaux, Angélus, and Talbot.
Subscribers can download a copy of the full Bordeaux Study 2018 from the analysis page.
Château Latour has released a parcel of their 2006 this morning at €450 ex-negociant. It is being offered in the UK at c.£430 per bottle. The factsheet below summarises its key points.
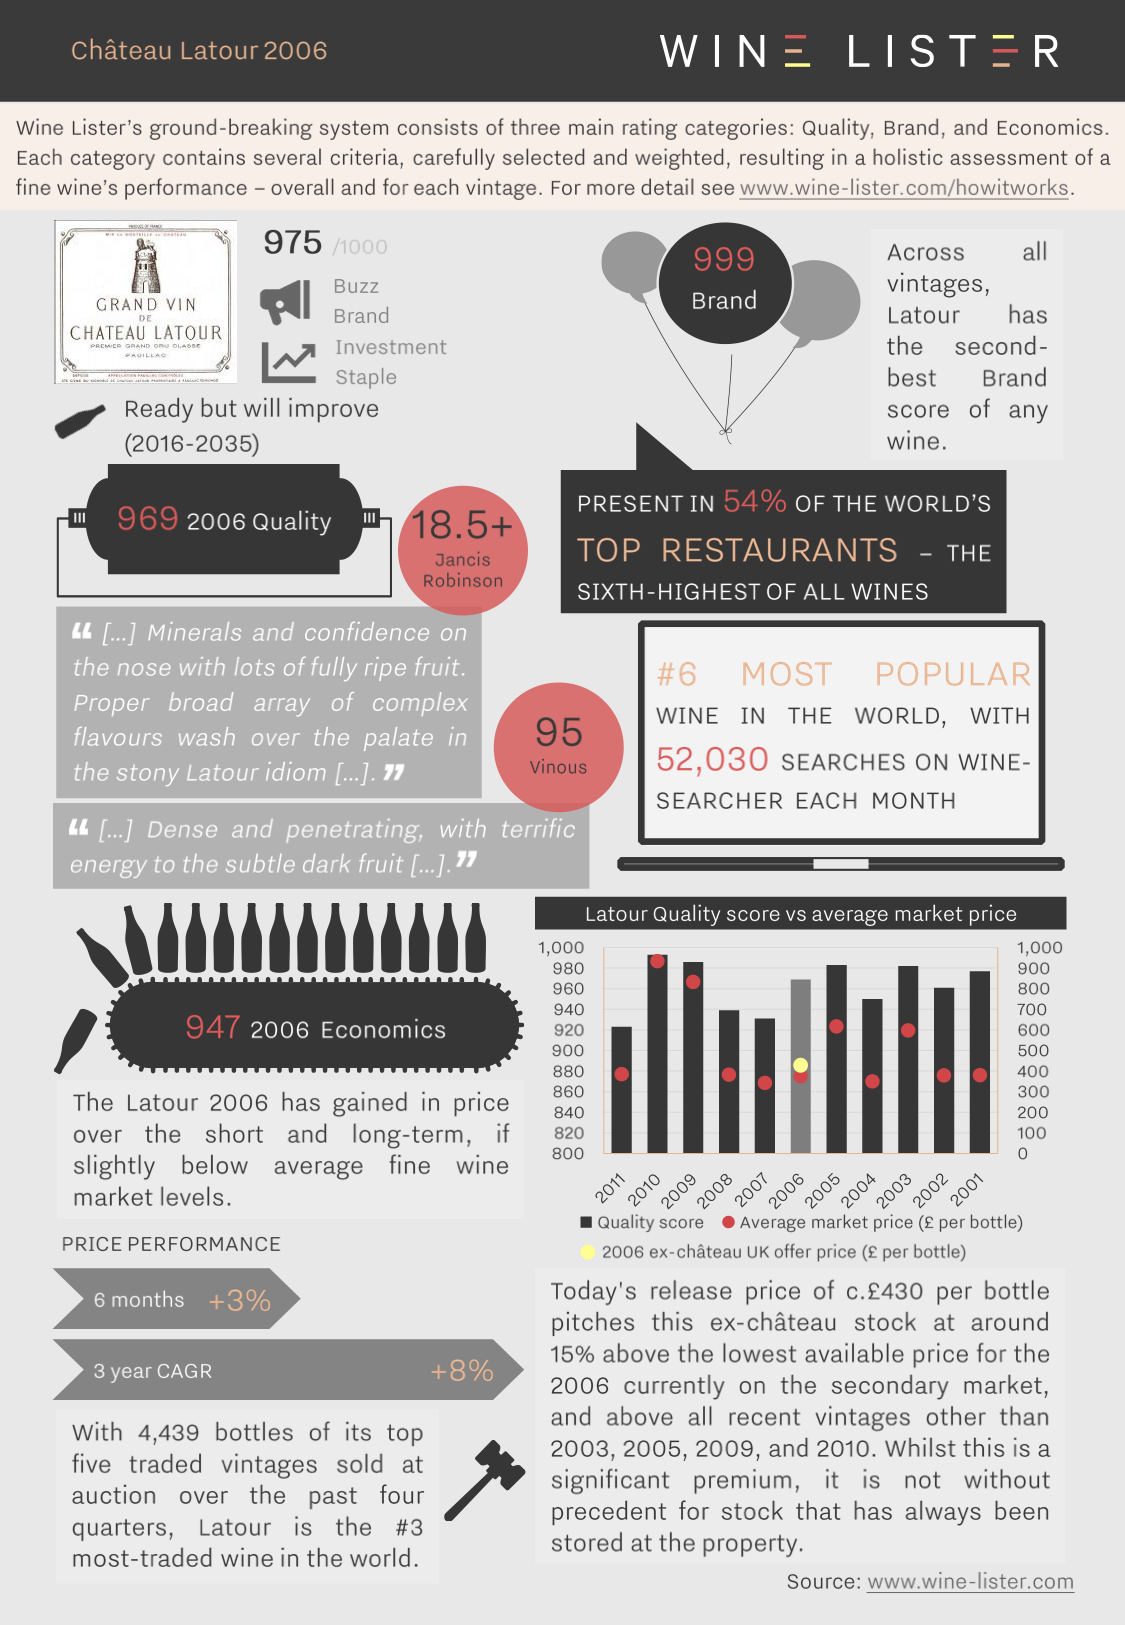
You can download this slide here: Wine Lister Factsheet Latour 2006
Château Latour has released a first parcel of Les Forts de Latour 2012 this morning at €145 per bottle ex-negociant. It is being offered in the UK at c.£153 per bottle. The factsheet below summarises its key points.
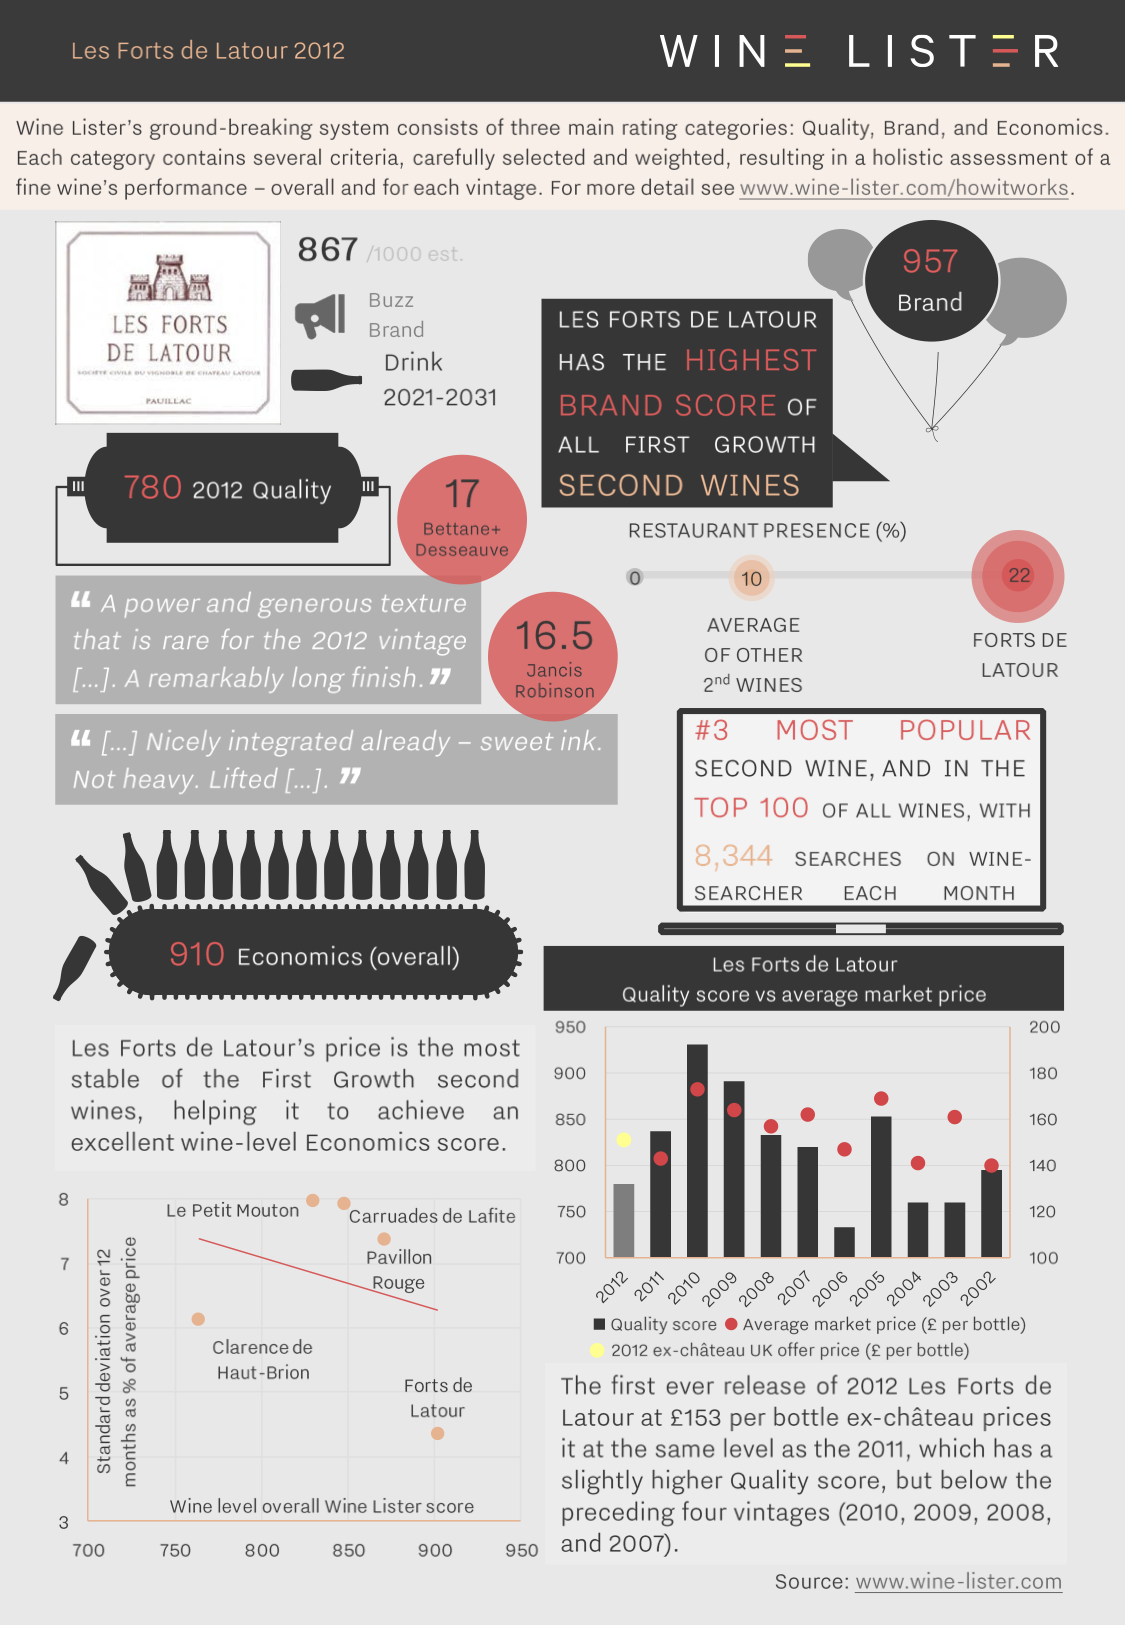
You can download this slide here: Wine Lister Factsheet Les Forts de Latour 2012
In this blog we look at the price performance of five major fine wine regions over the past two years. Wine Lister’s regional indices use price data from Wine Owners, and each comprises the top five brands in its respective region (according to the Wine Lister Brand score).
In Bordeaux, for example, the top five strongest brands (measured by looking at restaurant presence and online search frequency), are the five first growths, Haut-Brion, Lafite, Latour, Margaux, and Mouton. Posting gains of 28% over two years, and largely stagnating over the last year, the Wine Lister Bordeaux index is the worst performer of the five wine price indices shown below.
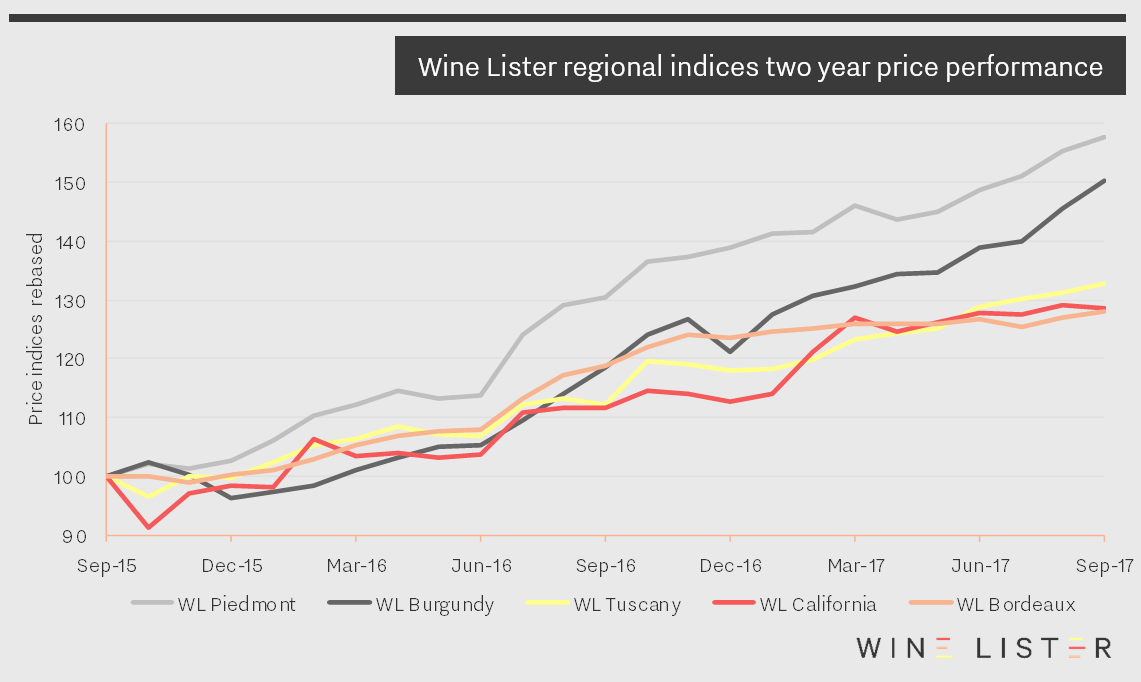
Piedmont, meanwhile, has enjoyed a remarkable couple of years. Not only has its index grown by an astonishing 58% over the period, it has also been very consistent, experiencing just three months of negative growth – November 2015, May 2016, and April 2017. Sustained high growth rates suggest a region in demand. The Wine Lister Piedmont index consists of two wines from Gaja – Barbaresco and Sperss (now labelled as a Barolo again after several years of declassification to Langhe Nebbiolo), two Barolos from Conterno – the Monfortino and the Cascina Francia, and finally Bartolo Mascarello’s Barolo.
Next comes the Burgundy index (consisting entirely of Domaine de la Romanée-Conti wines), which has grown by more than 50% over the past 24 months, but with a few more blips. It decreased in value by 4% in December 2015, only managing to recover in March 2016. In a repeat of this festive dip, the index dropped over 5% in December 2016, but recovered the losses in just one month on this occasion. It has started to close the gap on Piedmont over recent months, adding over 15% since May.
Tuscany and California* made similar gains to Bordeaux over the period – up 33% and 29% respectively. The Tuscany index has progressed fairly serenely over the past two years, thanks to its liquid Super Tuscan components. Meanwhile the prices of California’s top wines have been less consistent, enduring a fall of nearly 9% in October 2015, recovering with a dramatic 8% rise in February 2016. This year, having enjoyed strong gains during February and March, their growth rate has since cooled off, adding just 1.5% over the past six months.
*As you will know, California has suffered tragic wildfires in recent weeks. Wine Lister’s partner critic, Vinous, is donating to relevant charities the profits from all maps purchased before the end of November 2018.
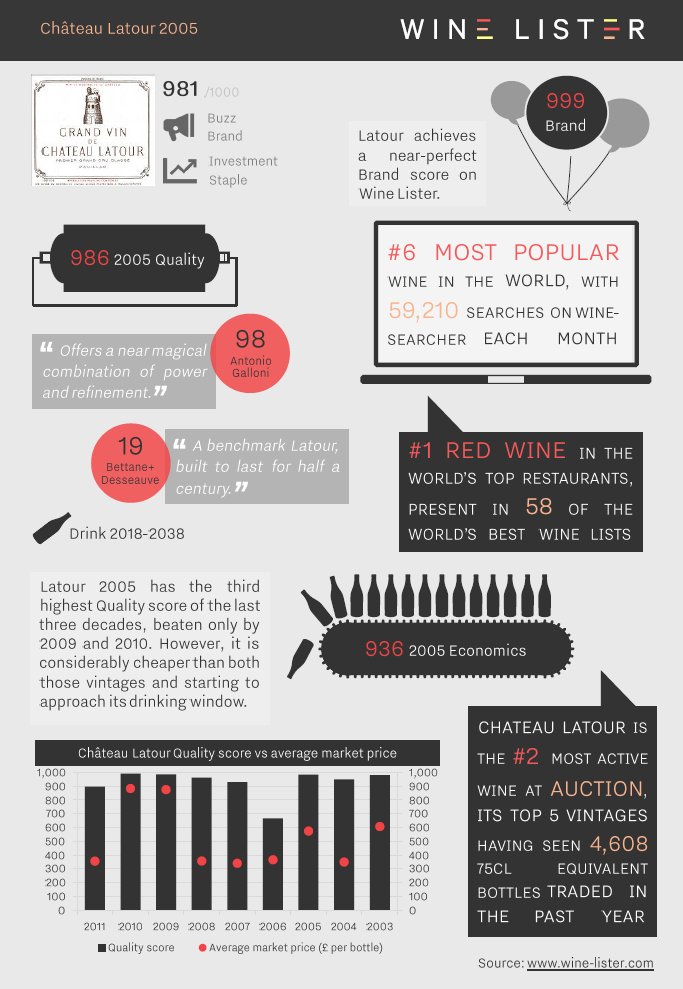
This morning sees the ex-château release of Latour 2005, along with second wine, Les Forts de Latour 2011. We have put together two factsheets bringing together all the most important information about these two formidable wines, both approaching their drinking windows.
The 2005 Grand Vin has the third-highest Wine Lister Quality score of the last three decades, and looks reasonable value next to the 2009 and 2010:
The 2011 vintage of Château Latour’s second wine, Les Forts de Latour, is an economic powerhouse, with impressive price growth since its release:
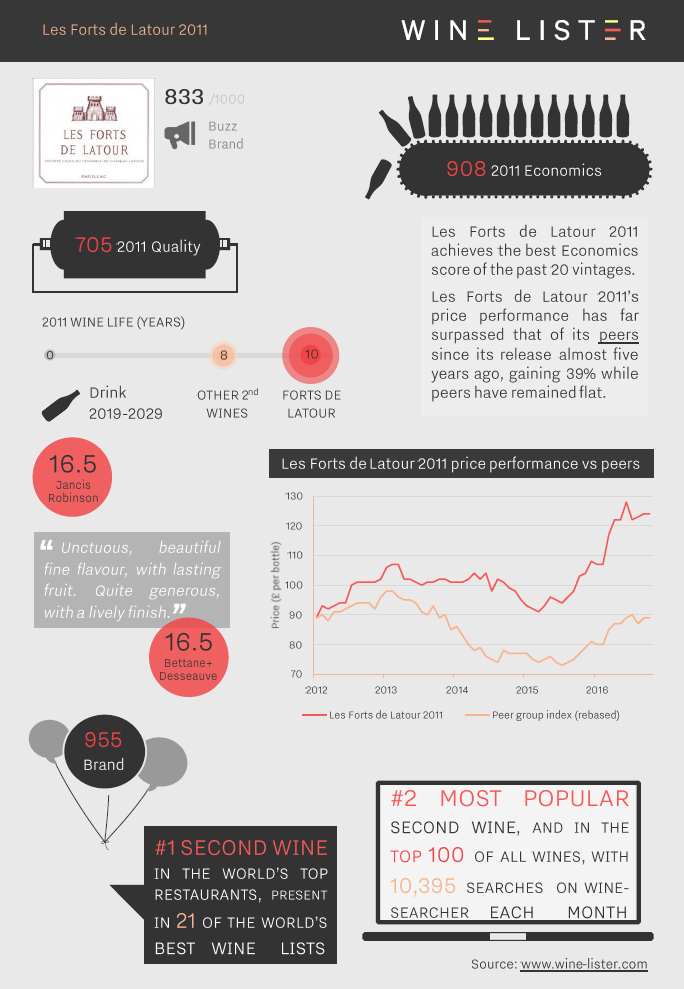
You can download the slides here: Wine Lister Factsheet Latour 2005 / Wine Lister Factsheet Les Forts de Latour 2011
Today saw by far the largest release of Latour direct from the cellars since the property withdrew from the en primeur system starting with the 2012 vintage. Château Latour has released c.3,000 cases of its 2007, the first real test of its new distribution strategy, and reports from the Place are positive. Courtiers and négociants say the price has worked (for the first time the ex-château stock is released at market level, with no “provenance premium”), and report that the entire parcel has been sold, with demand “very strong”.
Using Wine Lister’s unique combination of data, we’ve created a visual guide to this exceptional château and its 2007 vinatge:
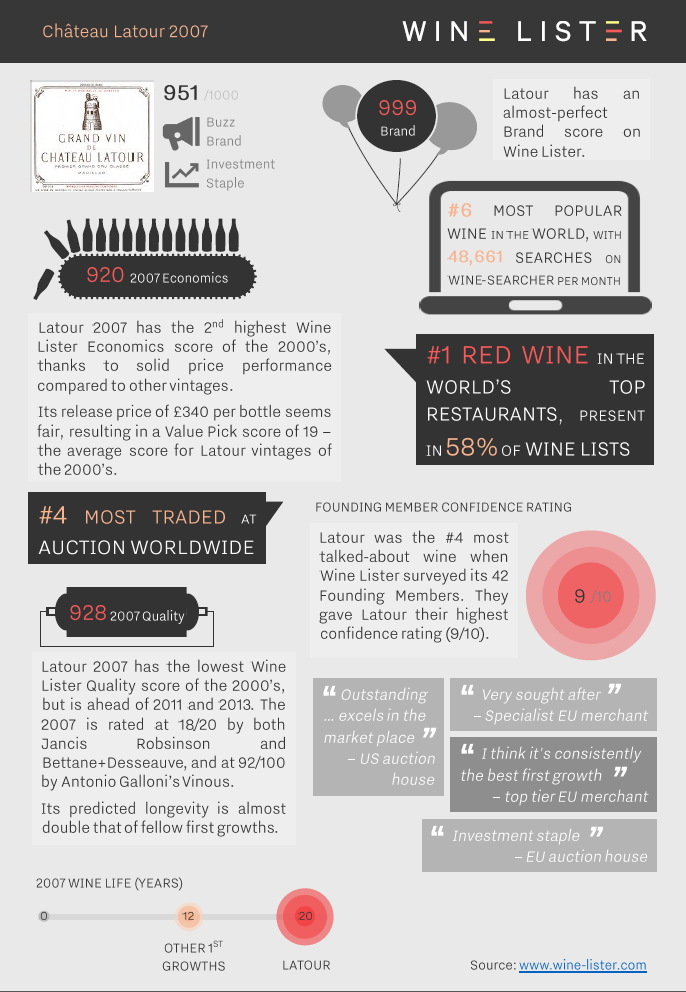
You can download the slide here: latour-2007-slide