Price nearly always plays a part in the decision-making process of purchasing wine. Typically, much emphasis is placed on the importance of “value” – “how much quality am I getting for the price of this bottle”, for which Wine Lister has its very own indicator, Value Picks. However is simply offering “good value” enough?
Wines purchased for long-term cellaring carry financial risk just as investment does. With this in mind, Wine Lister’s Economics scores reflect not only a wine’s price, but the performance of that figure over time. As well as a three-month average market price, and six-month / three-year price growth, Wine Lister’s algorithm takes into account price stability as a factor in determining a wine’s Economic strength.
Using historical prices provided by our data partner, Wine Owners, we calculate the standard deviation of a price over the last 12 months, expressed as a proportion of the average price over the same period.
Volatility can be caused by price movements both up and down. Nobody wants to see the price of a wine plummet after purchase, but equally, wines with prices rising too high and too fast display risk too, and are therefore also sanctioned with lower Economics scores.
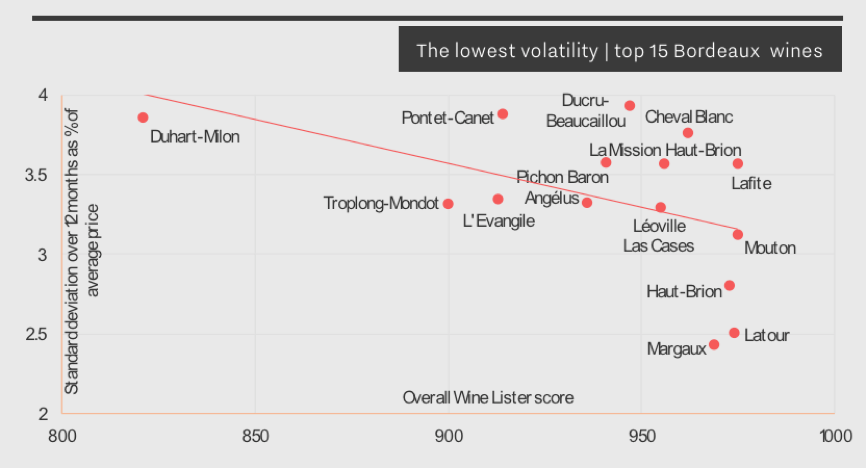
Below is an extract from this year’s Bordeaux Market Study featuring the 15 most stable Bordeaux wines. All five left bank first growths appear, testament that higher-scoring wines tend to experience less volatility. This is also tied in with liquidity: frequently traded wines tend to benefit from multiple reference points allowing a consistent market price to be determined. Conversely, a wine traded less frequently often sells at a markedly different price from one transaction to the next, resulting in a much more volatile market price.
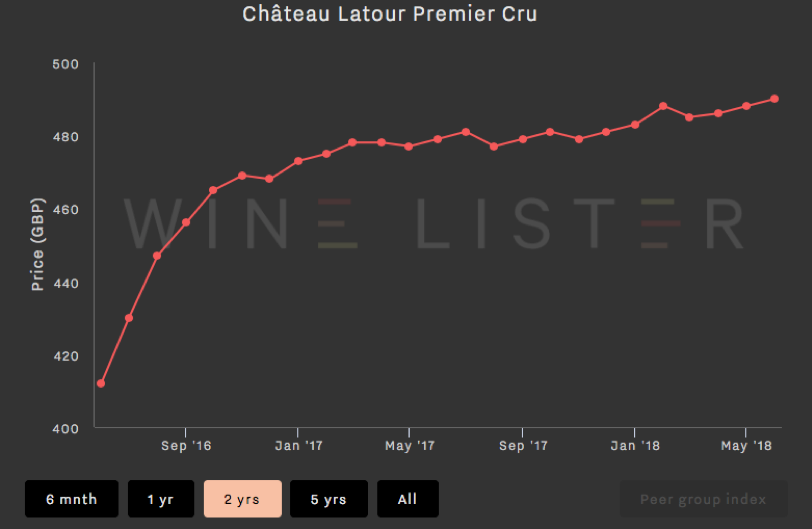
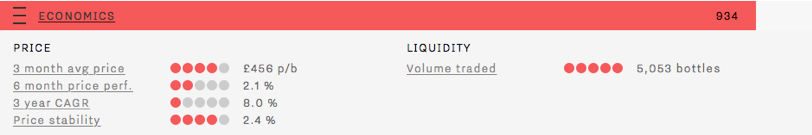
While Château Latour’s slow and steady price growth (as shown in the chart below) results in relatively low six-month price performance and three-year compound annual growth rate (CAGR) ratings, its strong Economics score is thanks to a high three-month average price, a high volume of bottles traded at auction, and a low price deviation of just 2.4% over the last 12 months.
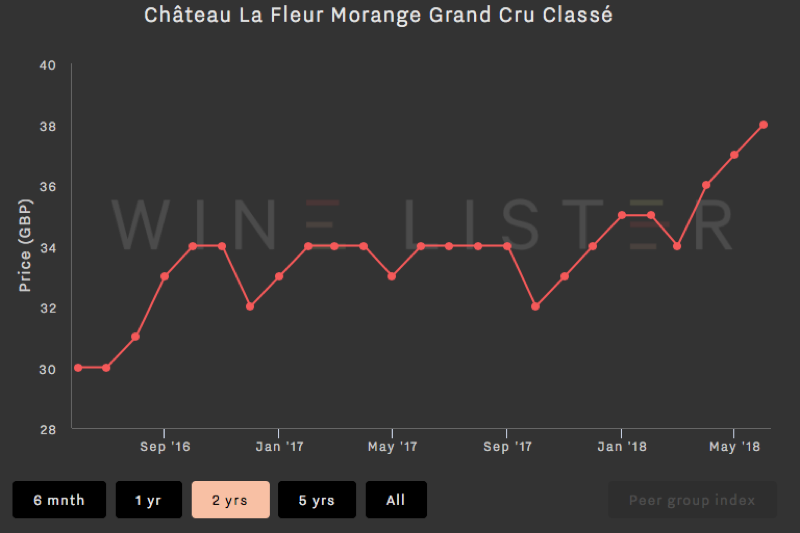
The chart below shows a very different picture – this wine has experienced a 14.7% price increase in six months. Though this in itself is positive, its price has therefore deviated 12.5% in the last 12 months, and the yo-yoing nature of the price over the longer term earns it a much lower Economics score (492).