Wine-Searcher is the world’s largest wine and spirits search engine, handling 250 million searches from around the world each year. This year, as part of Wine Lister’s annual Bordeaux study (Part II), we include data from Wine-Searcher exploring compound annual growth (CAGR) by Bordeaux appellation, average offers on Wine-Searcher by appellation, vintage, and geography, and average monthly searches by appellation and search location.
“There have been some subtle (and not-so-subtle) changes over the past year”, observes Wine-Searcher’s Editor, Don Kavanagh. “While Bordeaux still dominates both search and offer numbers, interest appears to have fallen slightly in relative terms.”
Bordeaux’s offer count on Wine-SearcherThough Bordeaux is still the major player on the world stage, with the highest total share of search activity of all major wine regions, its growth in rate of search is showing signs of being outpaced.
Searches for all wines over the past 12 months increased from 188 million to 205 million, slightly faster than searches for Bordeaux wines (up by 3 million to 39 million) during the same period.
Similarly, Bordeaux is not benefitting from the overall growth in offers on Wine-Searcher, which have risen from 6.8 million to 6.9 million over the last 12 months. Indeed, Bordeaux offers have shrunk slightly, from 791,000 to 786,000. Not all Bordeaux appellations were equally affected (see graph below).
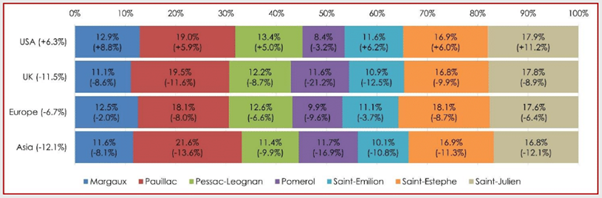
Average offer count per wine by appellation and merchant location, January - April 2022
During the first four months of 2022, there was a 6.7% contraction in offers from Europe (excluding the UK), with an even steeper reduction in offers from the UK and Asia, at 11.5% and 12.1% respectively, when compared with the same period in 2021. The USA’s number of monthly searches, as explored above, map neatly onto its increase in monthly offers per appellation (6.3% once again).
Search count by Bordeaux appellation and geographical location on Wine-Searcher
Search activity varied by geographical location in the period from January to April 2022, in comparison with the same period in 2021. While searches for Bordeaux appellations from the UK, Asia, and Europe (excluding the UK) decreased, the USA saw a 6.3% increase in search activity.
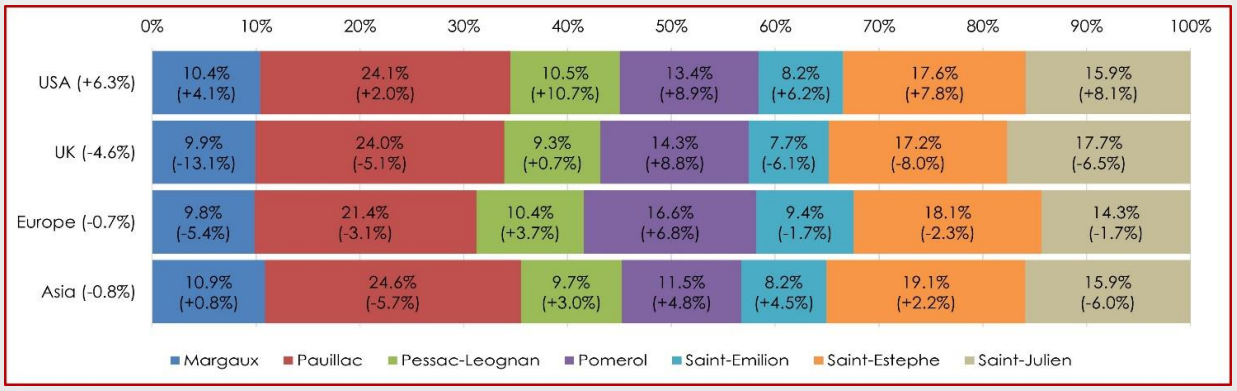
Average search count per wine by appellation and user location in 2022 (January – April)
Bordeaux’s price growth by appellation on Wine-Searcher
There are causes for optimism; growth with respect to global average prices (measured as a compound annual growth rate, or CAGR) in the period 2017-2022 has continued. The leader of the pack among Bordeaux appellations in this regard is Pomerol, reaching 6.1%. Even the lowest CAGR, exhibited by Saint-Emilion and Margaux, is 4.3%.
The year 2020-2021 remains an exception; compound annual growth rates jumped by 10% across all the examined appellations in that year.
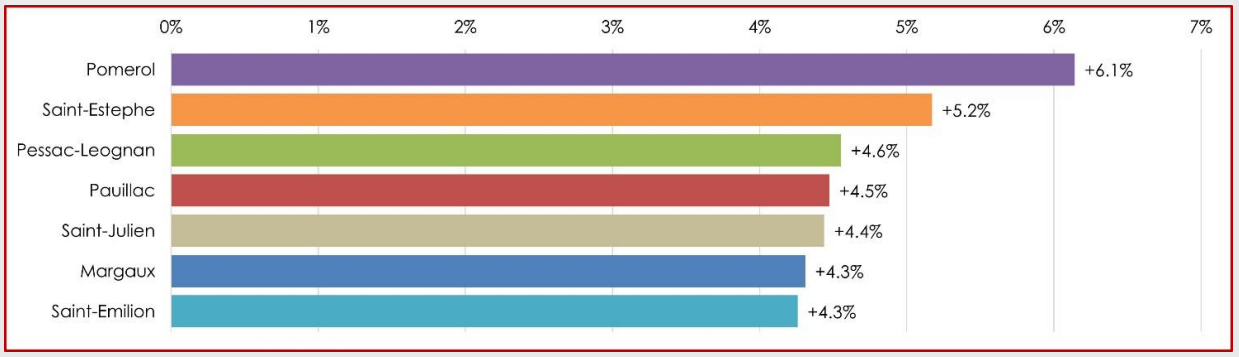
Compound annual growth by appellation, 2017 – 2022
The strength of the region’s compound annual growth rate is perhaps linked to the sharp decline in overall offer activity beginning in 2019, as compared with the longer-term average. While overall offer activity began to decrease, the proportion of offers between each appellation remained relatively stable in the period 2014-2020.
To view the full Wine-Searcher insert in Wine Lister’s annual Bordeaux study, and uncover more of Wine Lister’s analysis of the Bordeaux’s standing in 2022 – including quality scores, short-term price performance, and auction activity, as well as the topics discussed above – download the full report here.