Wine Lister Economics scores not only reflect a fine wine’s economic clout, but also predict its future price performance. The economics of fine wine are increasingly important. Some purists wish it weren’t the case (wouldn’t it be wonderful if quality could exist in isolation from pecuniary concerns?), but consider the plight of the producer making an exceptional wine, that without any brand recognition or commercial strategy doesn’t ever see the light of day. It never finds an importer, or its way into the consumer’s glass, let alone the investor’s portfolio.
That is why Wine Lister scores capture 12 data points across three rating categories, to measure the all-round performance of a fine wine in its journey from vine to glass. After Quality and Brand, the third Wine Lister rating category is Economics. The Economics score shows the producer whether its commercial strategy is working, but more than that, it can also serve to indicate to the collector whether the wine makes an economically sound investment.
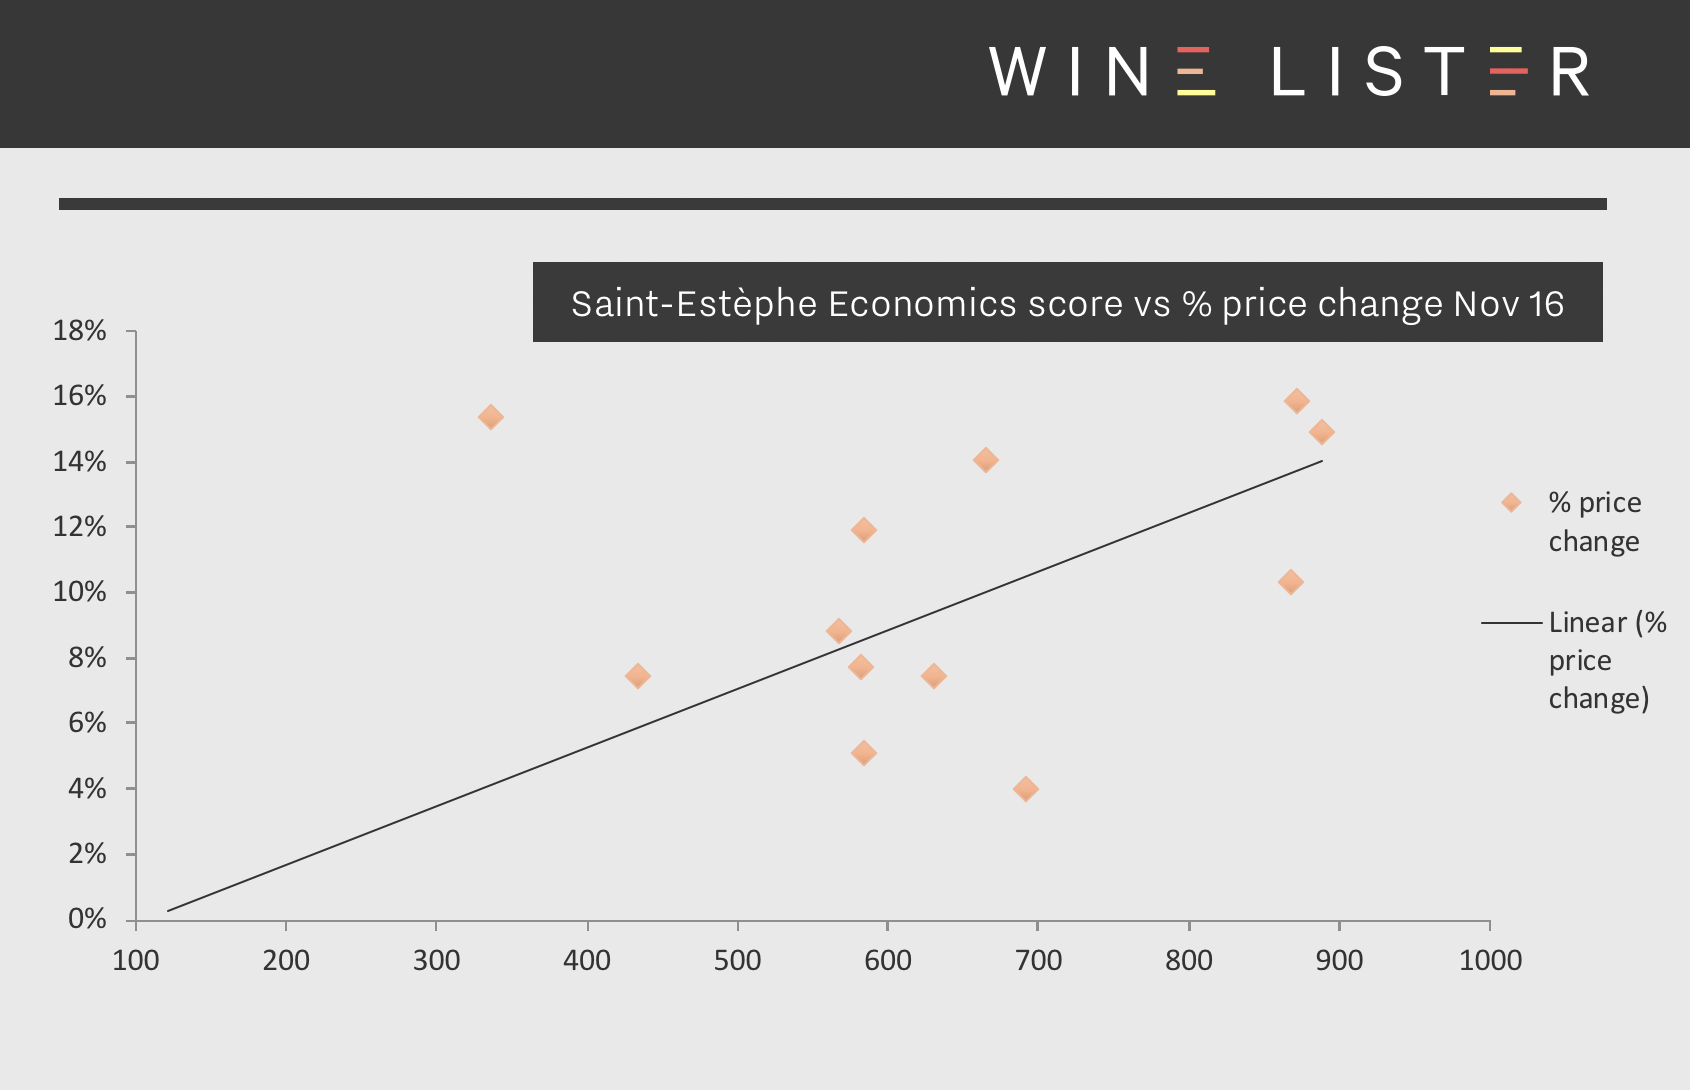
Bordeaux wines with an Economics score above 900 in November 2016 had increased by 17% in price on average by January 2018. By contrast, those with Economics scores below 600 gained just 8% subsequently. We can see this pattern in action in the chart below, which looks at Saint-Estèphe wines over the same 14-month period. The wines with the highest Economics scores at the beginning of the period proceeded to increase more in price than those with lower scores as a general rule.
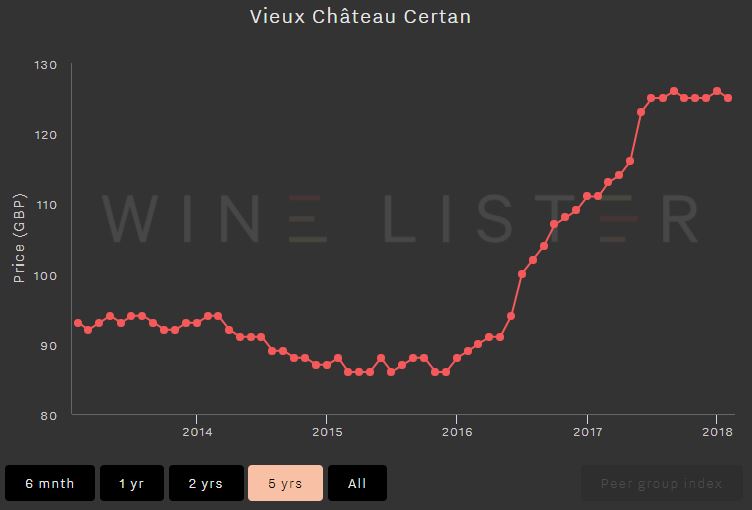
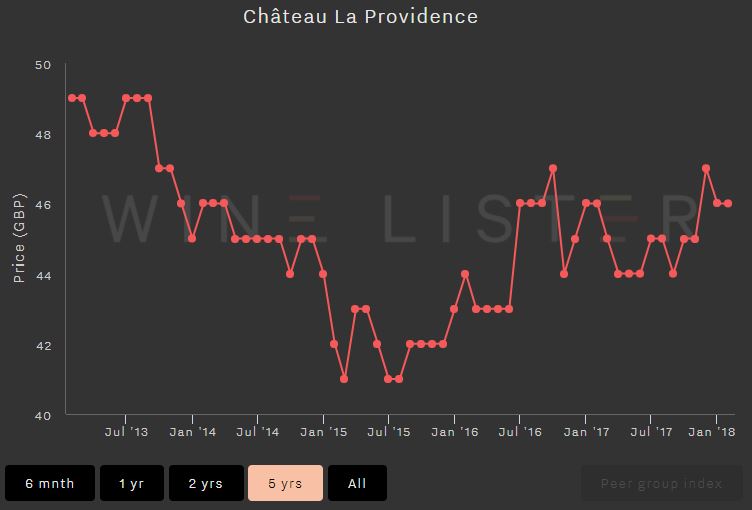
The below screenshots of Wine Lister’s price history tool illustrate graphically the difference between two wines with different economic profiles. Vieux Château Certan’s Economics score lies in the “strongest” portion of the Wine Lister 1000-point scale at 907/1000. While Château La Providence’s Quality score is strong (708/1000) its low Economics score of 389 is the result of a lower price, weak price performance, volatile prices, and modest trading volumes.
Wine Lister analyses five criteria in order to measure a wine’s economic strength, expressed as an Economics score out of 1,000. Four of these criteria use pricing data from our data partner, Wine Owners, while the fifth uses trading volume figures from the Wine Market Journal:
- 3 month average bottle price
This “market price” is the ultimate measure of what people are willing to pay for each wine in each vintage. Data is updated weekly, and bases prices on a three-month rolling average. Prices are shown In Bond per bottle.
- Short-term price performance
A wine’s financial strength also depends on its price performance. Wine Lister calculates price changes over six months for an indication of short-term price trends.
- Long-term price performance
Long-term performance measures a wine’s compound annual growth rate over three years.
- Price stability
Price fluctuations over a 12-month period are distilled into the measure of a wine’s stability. Wines with less volatility are more consistent, less risky and therefore earn a better Economics score.
- Volume traded
Added to pricing information is data on a wine’s liquidity. A wine can have good price performance but lack the current market demand, potentially making it a less attractive wine for investment.