New score history tool: see how scores have changed and why
Here at Wine Lister we’re continually importing and crunching new data to ensure our scores reflect the most up to date picture of each wine’s quality, brand strength, and economic performance.
Economics scores, which comprise five criteria, including six-month price performance and price stability, are updated each week to capture the latest wine price data from our price data partner Wine Owners. Meanwhile Brand scores are updated every month to reflect changes in online search data – how often a wine is searched for on partner site Wine-Searcher.
Now we’ve added a new tool to the site allowing users to track the evolution of every wine’s score over time, identifying how and why the score has changed following each data update.
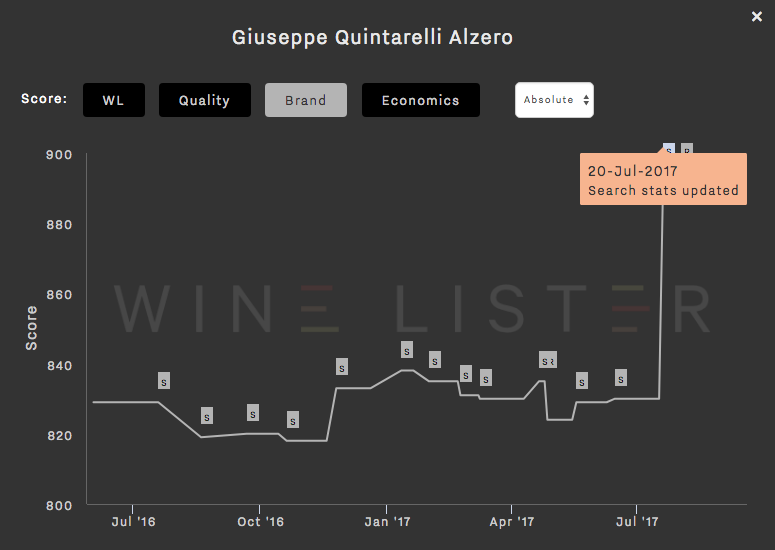
The interactive chart shows how a wine’s overall Wine Lister score, as well as its category scores, have changed over time, and includes flags to show users what data was updated and when.
For example, using the tool for Giuseppe Quintarelli Alzero, you can see its brand score shoot up in July 2017. The flag tells us this was due to a search statistics update (it turns out LeBron James posted a photo on Instagram of a bottle of the 2007 that he was enjoying):
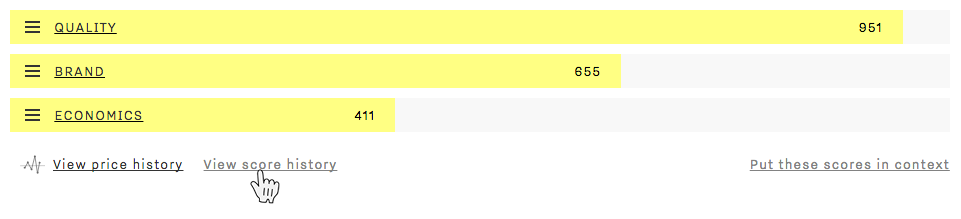
The tool also allows the different category scores to be rebased enabling easy comparison of their relative performance over time. Try it out for yourself by searching any wine and clicking “View score history”, on the wine page, underneath the category score bars: